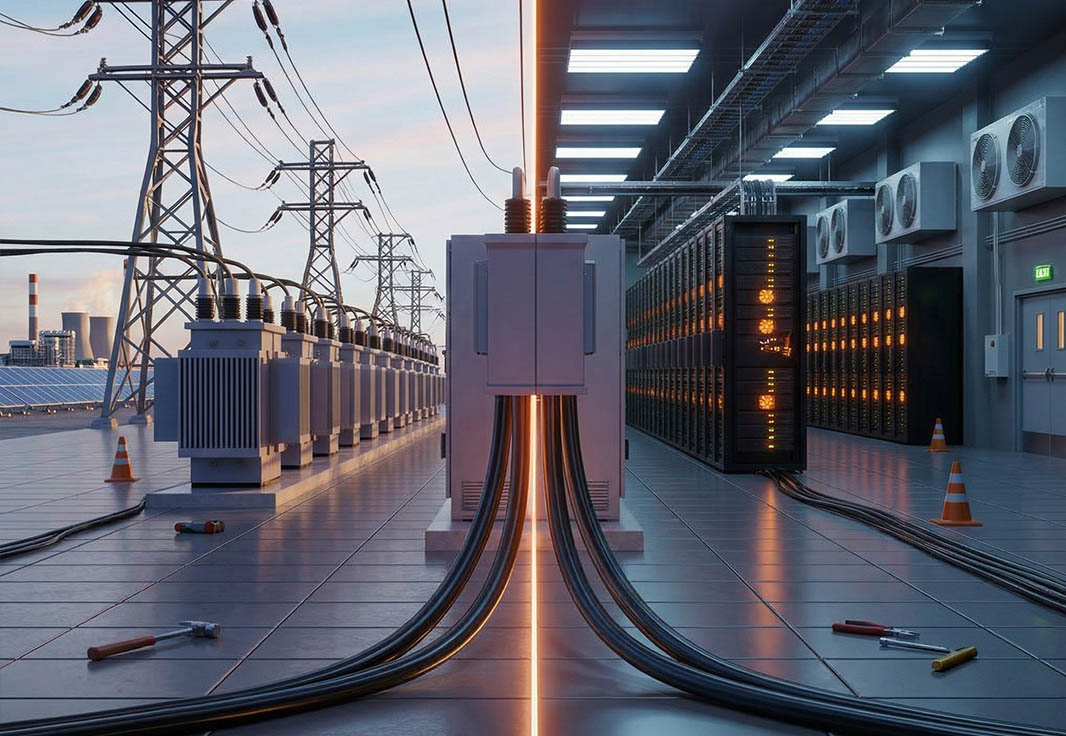
Inside the $11 Billion Data Center: The Real Cost of Powering AI
Table of Contents
The $11 Billion Blueprint: Breaking Down a 400 MW Facility
Gray Space vs. White Space: Where the Money Sits
The Physics of AI: Why 800V DC is Non-Negotiable
The Liquid Cooling Revolution
Market Trajectory: The $220B Supercycle
The Bottom Line
The Equipment Layer Behind AI Infrastructure
The global conversation about AI infrastructure has largely centered on chips, hyperscaler capex, and power constraints. Less examined - but equally consequential for capital allocators - is the equipment layer sitting between the utility grid and the GPU rack. The transformers, switchgear, uninterruptible power supplies, cooling systems, busbars, and back-up generators that compose a modern data center’s physical infrastructure are experiencing a demand surge with few historical parallels.
Recent industry analysis sizes the addressable equipment market for electricals and HVAC at ~$220 bn per annum over 2026–2030. That figure has more than tripled from roughly $60 bn per annum estimated just two years ago. The expansion is not purely a function of more data centers being built it reflects a fundamental increase in the complexity and cost of each megawatt deployed.
This is the fourth piece in our ongoing data center series. We first examined the asset class foundations in The Expanding Role of Data Centers, then mapped the macro capacity and regional dynamics in Data Center Market Outlook 2030, and followed with an investor’s playbook in How to Invest in Data Centers: AI Infrastructure Profits. Each installment has moved closer to the physical infrastructure. This one goes inside the facility itself - component by component - and asks: where exactly do the equipment dollars concentrate, what does the coming shift to 800V DC architecture mean for content risk, and can the current order momentum be sustained?
Executive Summary
- $220 billion annual addressable market for electricals and HVAC (2026–2030): More than 3x the ~$60 bn estimated in 2024. The increase reflects tripled capacity additions (~20 GW/year vs. prior ~7 GW/year) and rising infrastructure cost per watt ($10/W vs. prior $7/W), driven by growing facility complexity and strong component pricing.
- Rack power density - the forcing function behind nearly every architectural change - has doubled in two years: Global average density sits at 17 kW per rack. AI-equipped racks already draw 120–150 kW, and next-generation GPU platforms are projected to push single-rack consumption past 1 MW by 2027–2028. This trajectory is breaking traditional power delivery and cooling architectures.
- 800V DC power distribution is gaining attention but adoption will be gradual: Industry estimates suggest only 15–25% of data centers will run on 800VDC by 2030, with most early deployments using content-neutral side-car designs. The main disruption risk concentrates on the UPS (~16% of infrastructure content), while cooling systems and racks stand to benefit.
- Hyperscaler capex shows no sign of deceleration: Consensus projects a 57% jump in aggregate hyperscaler spending in 2026 (after ~60% growth in both 2024 & 2025), with aggregate 2026–2027 estimates having risen 60–65% since the start of the year and sitting roughly 200% above where they were at the beginning of 2025.
- Datacenter segment growth is running far above corporate mid-term guidance: While companies broadly guide for 15%+ annual growth, actual reported datacenter revenue growth averaged ~50% across the sector in 2025 and ~35% in 2024. Order growth has been even more pronounced, with several participants reporting 100–250%+ year-over-year increases in recent quarters.
- A clear statistical relationship has emerged between datacenter revenue exposure and total organic growth: On a 5-year lookback, the correlation between a company’s datacenter sales mix and its organic revenue CAGR yields an R² of ~0.72 - a substantially stronger fit than in prior analysis - suggesting that datacenter exposure has become the defining growth differentiator in the global electricals/HVAC sector.
Dissecting a Data Center Where $11 Billion Goes in a 400 MW Facility
A useful way to understand the equipment opportunity is to break apart the cost anatomy of a single large facility. Based on component-level modeling of a hypothetical 400 MW US-based data center with N+1 redundancy and conventional air cooling, the total project cost comes to ~$11 bn, or roughly $27.50 per watt.
Cost Anatomy of a 400 MW Data Center: Three Layers
Note: Based on a 400 MW US-based facility with N+1 redundancy and conventional air cooling. Figures reflect 2025 construction economics in the Northern Virginia and Dallas-Fort Worth data center corridors.
Equipment vendors have independently sized their revenue opportunity per MW of AI data center capacity. The figures converge remarkably: ~$3.5 Mn, $3.4 Mn, $3.3 Mn, and $3.1 Mn per MW from various major participants. Compare this to ~$1.2 Mn per MW for traditional non-AI facilities. That roughly 3x content multiplier per megawatt - multiplied by faster megawatt growth - is the compound engine behind the $220 bn annual market.
Inside the Infrastructure Stack: What Drives the Spending
Breaking the infrastructure layer into its four constituent categories reveals important distinctions.
Gray Space - 29% of Infrastructure Cost
This is the heavy electrical back-end: UPS systems, switchgear, transformers, circuit breakers, and transfer switches. These are mission-critical, highly customized products with concentrated supplier bases. Margins tend to be superior because specifications are exacting, switching costs are high, and failure consequences are catastrophic. The UPS alone accounts for 16% of total infrastructure spending and is the single largest electrical component. Switchgear represents 11% and transformers roughly 2%.
White Space - 10% of Infrastructure Cost
The IT room itself: server racks, cable management, power distribution units (PDUs), and busbars/busways. Lower margins than gray space given more standardized products and greater competition, though rising rack complexity (larger enclosures, higher-density cable management) is creating incremental content opportunity.
Cooling - 32% of Infrastructure Cost
The largest category by spend. Computer room air handlers (CRAHs) at 12%, chillers at 9%, and cooling pumps/pipes/towers making up the rest. Importantly, this reflects a conventional air-cooled architecture. As AI racks drive density past 40–50 kW - the threshold where air cooling becomes insufficient for chip longevity - liquid cooling (direct-to-chip, immersion, coolant distribution units) adds a higher-margin layer on top. The global liquid cooling market is estimated to grow at roughly 35% per year, reaching over $6 bn by 2028. This is additive: air cooling does not disappear, because networking, storage, and non-AI compute systems still require conventional thermal management.
Other - 29% of Infrastructure Cost
Dominated by back-up generators (19%), plus building management systems (4%) and fire/security (6%). Diesel generators remain standard, though industry discussions are exploring modular battery storage and renewable microgrids as alternatives - a shift with significant implications for power generation equipment suppliers.
Datacenter Infrastructure Content Breakdown - 400 MW Facility Model
Source: Derived from industry component-level cost modeling. Based on 400 MW US facility, N+1 redundancy, air-cooled architecture.
The table highlights a counterintuitive pattern: the categories with the highest disruption risk from 800VDC (UPS, switchgear, transformers) represent only about 29% of infrastructure spend. The categories positioned to benefit - cooling, racks - account for 35%. The remaining 36% (generators, fire/security, building management) are largely unaffected. In aggregate, the infrastructure content opportunity expands even in a scenario where 800VDC adoption accelerates, because cooling complexity grows faster than gray-space components shrink.
800V DC: The Physics Forcing the Architecture Change
The shift toward 800V DC power is not a technology fashion - it is a physical necessity imposed by escalating rack density. Consider the trajectory: a typical AI rack drew 40 kW in 2022. Today’s leading accelerator platforms support 120–150 kW per rack. By 2027, next-generation GPU platforms paired with advanced rack designs are expected to push past 1 MW per rack.
At these densities, conventional 415V AC architecture hits multiple physical limits simultaneously.
Why 415V AC Breaks at Megawatt-Scale Rack Densities
Cables Melt
Every cable has a maximum current rating beyond which it becomes inefficient or fails. Delivering 1 MW at 415V AC requires substantially thicker cables that take up physical space, disrupt cooling airflow, and consume significant copper. The International Copper Association estimates data center copper consumption will reach 725,000 tonnes annually by 2030 - equivalent to 2.5% of global copper output. At 800V DC, a cable carries roughly 3x the power of a 415V AC cable for the same thickness, reducing copper requirements by 40–70% in advanced designs.
Ancillary Components Crowd Out Compute
As rack power increases, the supporting infrastructure (converters, power shelves, cooling loops) scales up and competes for physical space within standardized rack enclosures. At megawatt scale, the power shelves alone would occupy 1.5 racks - before any compute hardware. The practical near-term solution is the “side-car” design, splitting racks into dedicated IT and dedicated power/cooling enclosures. This is already being deployed and requires minimal changes to existing facility layouts.
Conversion Losses Compound
In a conventional AC data center, power passes through multiple conversion stages - transformer, UPS (AC→DC→AC), rack distribution, and power shelf unit - each consuming a slice of energy. The UPS alone operates at only 92–96% efficiency. By the time power reaches the compute chip, only 80–85% of the original input remains usable. A DC-native architecture eliminates the most lossy conversion steps and delivers roughly 95% efficiency. While electricity represents only about 10% of total facility cost of ownership, the constraint is not cost - it is availability. In power-constrained regions, reclaiming 10–15 percentage points of efficiency is equivalent to adding free capacity.
GPU Power Fluctuations Stress the Grid
AI accelerators can swing between 10% and 50% of maximum power draw within fractions of a second. At the scale of a modern hyperscale facility, these rapid fluctuations can destabilize the local grid - making utilities reluctant to approve connections. Battery energy storage systems (BESS), paired with DC power distribution, act as buffers that smooth these transients. This is a key reason BESS integration is emerging alongside 800VDC, not merely as backup power but as a grid-friendliness enabler that unlocks faster utility approvals.
800V DC Adoption Timeline
The timeline for these architectural shifts is staggered. Side-car configurations are commercially available now and represent a minimal evolution. Hybrid AC/DC designs using upstream rectifiers are expected by 2027–2028. The idealized “direct-to-chip” architecture - using solid-state transformers to convert grid-level 35kV AC directly to 800V DC in a single step - remains a post-2030 solution, with no mass-market solid-state transformer product currently available.
Critically, not every data center needs 800VDC. The benefits are most pronounced for AI training clusters running at megawatt-scale rack densities. For inference workloads, enterprise computing, and colocation facilities running at lower densities, traditional architectures remain adequate. Industry consensus places 800VDC penetration at just 15–25% of all facilities by 2030, with most early adopters likely using the relatively content-neutral side-car design.
The Capex Signal: Order Books Don’t Lie
The equipment growth thesis rests on a capex cycle that has not merely sustained itself - it has repeatedly surprised to the upside. Consensus expectations for aggregate hyperscaler capital spending now stand at ~$782 bn for 2026 and $844 bn for 2027. The 2026 figure represents a 57% yoy increase, following roughly 60% growth in each of 2024 and 2025. Since the start of 2026, consensus estimates for both years have risen 60–65%, and they sit nearly 200% above where expectations were at the start of 2025.
The increases are broad-based but not uniform. The largest percentage increases yoy are coming from smaller-base entrants expanding into AI infrastructure. The largest absolute increases are concentrated among the two biggest spenders, with individual companies adding $66–90 bn in annual capex. Even after adjusting for memory chip price inflation - estimated at roughly one-third of the total capex increase - underlying infrastructure spending continues to ramp above prior expectations.
What stands out in recent hyperscaler commentary is a shift in tone. Two years ago, management teams spoke cautiously about the pathway to AI profitability. Today, the language is far more decisive: compute demand is outstripping infrastructure supply, capacity constraints will persist through much of 2026, and the return profile of AI infrastructure investments is becoming clearer as use cases proliferate.
At the equipment supplier level, this capex conviction is translating into extraordinary order activity. In the most recent reporting period, one major participant recorded a 252% yoy increase in organic orders - more than double what the sell-side expected - driven by larger-sized system orders across integrated white space, prefab, and end-to-end power and thermal solutions. Another reported 200% datacenter order growth, with its negotiations pipeline reaching ~$10 bn (up from $2.4 bn in 2019) and backlog growing to $15 bn - a fivefold increase since 2019 with a 12–18 month order-to-revenue conversion cycle.
These are not isolated data points. A distributor that had 9% datacenter exposure and $2 bn in datacenter sales two years ago now derives 18% of revenue from the segment with $4.3 bn in sales - a 50% increase in a single year, far outpacing initial mid-teens guidance. A cooling-focused HVAC participant doubled its datacenter revenue from $500 Mn to $1 bn in 2025 and expects to grow another 50% to $1.5 bn in 2026, with orders up 4x in the most recent quarter. A thermal management specialist raised its two-year datacenter revenue growth target from a 45–55% CAGR to 50–70% after posting 78% organic sales growth in its most recent period.
In aggregate, capital deployment into datacenter-related acquisitions has been substantial. One major electrical equipment company alone has deployed ~$11 bn in datacenter-related acquisitions since 2024, spanning liquid cooling, prefabricated modular pods, and solid-state transformer technology. For context, that figure exceeds the combined capital it deployed into share buybacks and aerospace acquisitions over the same period.
Mechanics That Matter: What the Numbers Reveal
Datacenter Exposure as a Growth Predictor
The correlation between a company’s datacenter sales exposure and its organic revenue growth rate has tightened meaningfully over the past two years. On a 5-year lookback, the R² is ~0.72 - a notably stronger fit than in 2024 analysis. The most exposed participant (roughly 85% datacenter) delivered an 18% organic sales CAGR over five years. Companies with single-digit datacenter exposure clustered around mid-single-digit organic growth. The implication: for the global electricals/HVAC sector, datacenter mix is no longer just a growth accelerant - it is becoming the primary determinant of top-line trajectory.
Datacenter Growth Is Overwhelming Everything Else in the P&L
A telling exercise: applying a 27–29% organic growth assumption (consistent with the most datacenter-exposed company’s 2026 guidance) to the datacenter portion of a diversified electrical equipment company’s revenue implies that the rest of the business needs to grow only ~2% to hit overall guidance. For a white-space-focused player, the rest of the business could actually shrink by 3% and still hit the mid-point. This math explains why the fastest-growing companies in the sector are, almost without exception, the ones with the highest datacenter concentration.
Content Per MW Is Increasing, Not Stabilizing
The revenue opportunity per MW in AI data centers ($2.9–3.5 Mn) is roughly 3x the traditional figure ($1.2 Mn). But this gap may widen further. As rack density climbs toward 1 MW+ and liquid cooling becomes mandatory, the thermal and power delivery content per megawatt increases non-linearly. Liquid cooling alone adds an estimated $0.5 Mn per MW of revenue opportunity. Side-car rack configurations introduce entirely new content categories - localized battery storage, dedicated power shelves, higher-specification cabling - that did not exist in conventional layouts. The risk scenario of 800VDC reducing total content appears, on balance, less likely than the scenario of total content per facility rising even as the composition shifts.
Gray Space Margins vs. White Space Margins
Gray-space products (UPS, switchgear, transformers) are inherently more customized, serve more concentrated buyer bases, and carry higher switching costs. White-space products (racks, PDUs, cable trays) are more standardized and competitive. Within cooling, liquid cooling solutions command meaningfully better margins than conventional air cooling due to technical complexity and application-specific design. As the industry mix tilts toward liquid cooling and higher-density gray-space specifications, the margin implications are constructive.
The High-Voltage Substation Opportunity
One participant has sized the high-voltage opportunity (predominantly substation content, grid connection, and electrical distribution) at $0.2–0.3 Mn per MW - a fraction of the internal facility equipment opportunity but reflecting a distinct and growing market. As data center grid connections become more complex, this upstream opportunity compounds alongside the facility-level equipment demand.
Space Data Centers: A Useful Thought Experiment, Not an Investment Thesis
The idea of orbital data centers has attracted commentary from prominent technology leaders, who cite the appeal of abundant, uninterrupted solar power in space versus increasingly constrained terrestrial grids. The reasoning is straightforward: data centers already consume roughly 2% of global electricity, and with capacity expected to double within five years, the constraint is only tightening.
The economics, however, remain prohibitive. Based on industry modeling, a 1 GW orbital data center would cost ~4x its terrestrial equivalent on a capital expenditure basis. The primary cost drivers are additional space infrastructure (power systems, redundancies), launch costs, and the extreme operational challenges of maintenance - there are no technicians in orbit, and GPU replacement alone would require expensive and complex in-orbit servicing.
Perhaps more importantly, the business case suffers from a denominator problem. Electricity currently represents only about 15% of total data center cost of ownership. Even if space-based solar power were effectively free, savings on 15% of the cost base cannot overcome a 4x capex premium. A pathway to comparable unit economics would require simultaneously achieving a 75% reduction in launch costs (50% below current long-term targets), a 50% reduction in ancillary space costs, and a 4x increase in terrestrial electricity prices. That combination appears remote.
The investable angle today is limited to specific dual-use technologies - radiation-hardened chips, space-grade solar arrays, in-orbit servicing robotics - that generate revenue through existing satellite and defense programs and do not depend on space data centers as part of their business case.
What Remains Uncertain: Key Risks to the Thesis
- 800VDC adoption pace and design convergence are still fluid: Company commentary has been sparse, partly because eventual end-state architectures remain uncertain. The gap between the side-car (available now, content-neutral) and direct-to-chip (post-2030, content-disruptive) is wide, and the intervening hybrid designs could land in many configurations.
- Safety standards for high-voltage DC systems inside data centers are undefined: Higher voltages increase electrical arcing risk and worker safety exposure. National electrical codes and engineering standards bodies are still working through both the higher voltage and the DC-instead-of-AC dimensions. Until these standards crystallize, adoption will face institutional drag.
- The liquid cooling inflection depends on next-generation GPU deployment timelines: If inference workloads grow faster than training - at lower rack densities - the liquid cooling ramp could be less aggressive than current projections imply. The ~35% CAGR assumption bakes in rapid adoption of accelerators that require 100% liquid cooling at 1 MW+ rack density.
- Hyperscaler capex durability beyond 2027 is not guaranteed: While current backlog visibility extends 12–18 months and frame agreements with customers reach through the end of the decade, the spending trajectory is ultimately a function of AI monetization velocity. Slower-than-expected revenue realization from generative AI could lead to capex moderation.
- Supply chain normalization for critical equipment remains years away: Lead times for generators, turbines, and switchgear remain at 100–150 weeks, with normalization not expected until 2029. This creates schedule variance and could limit the pace at which the equipment opportunity converts to revenue.
- Component price sustainability is uncertain: The strong price and mix tailwind of the past two years reflects both genuine complexity increases and favorable supply-demand dynamics. As equipment manufacturers expand capacity - with multiple players executing simultaneous capacity expansion programs - pricing power could moderate if supply catches up.
- Near-term margin risk from capacity ramps: Several participants are quadrupling or doubling manufacturing capacity within compressed timeframes. Ramp-related inefficiencies, staffing costs, and commissioning delays could weigh on margins even as top-line growth accelerates.
- Standardization of liquid cooling products may invite more entrants: Industry bodies are developing new guidelines for cooling capacity parameters. Greater clarity could accelerate adoption but also reduce differentiation among suppliers.
Conclusion
The data center equipment market has entered a structural growth regime unlike anything the global electricals and HVAC sector has experienced. The addressable opportunity has tripled in two years - not because forecasts were aggressive, but because they were too conservative. Capacity additions have nearly tripled, infrastructure cost per watt has risen 40%, and the content multiplier between traditional and AI facilities has widened to roughly 3x.
The coming transition to 800V DC power architecture introduces genuine content risk in specific gray-space components, most notably the UPS. But the analysis suggests a more nuanced picture than the headline disruption narrative implies. Only 15–25% of facilities are expected to adopt 800VDC by 2030. Most early deployments will use side-car designs that are roughly content-neutral. And the categories positioned to benefit - cooling, racks, BESS integration - represent a larger share of infrastructure spend than those at risk. The net effect, on balance, appears to be expanding total content per facility even as the composition shifts.
What is unusual about this cycle is the breadth of confirmation across multiple data points. Hyperscaler capex guidance continues to ratchet higher. Equipment order growth is running at multiples of revenue growth, building backlogs that extend through the decade. The statistical correlation between datacenter exposure and company-level organic growth has strengthened, not weakened. And capital deployment - $11 bn in datacenter acquisitions from a single company in two years - reflects conviction, not speculation.
The key question going forward is not whether the equipment demand is real. The order books have answered that. The question is whether the industrial supply chain can scale fast enough to convert demand into delivered capacity - and whether the current pricing environment can be sustained as manufacturing capacity expands. For capital allocators tracking AI infrastructure, the equipment layer has moved from a supporting subplot to the central mechanism through which the buildout either accelerates or stalls.