.avif)
The Top 10: Steering the S&P 500's Future and What It Means for Investors
Investors who are looking for exposure to the S&P 500 usually have a broader market in mind. However, the top 10 companies now represent about 32% of the total value of the index, putting market diversification at stake. Regarding U.S. economy the phrase “whatever happens to S&P 500 is the same with the market” reveals how this index is utilized as a gauge for it; this is mainly because top 10 companies serve as giants within the same area who control everything regarding customer’s accounts.
Introduction
Investors who are looking for exposure to the S&P 500 usually have a broader market in mind. However, The top 10 companies now represent about 32% of the total value of the index, putting market diversification at stake. Regarding U.S. economy the phrase “whatever happens to S&P 500 is the same with the market ”reveals how this index is utilized as a gauge for it; this is mainly because top 10 companies serve as giants within the same area who control everything regarding customer’s accounts.
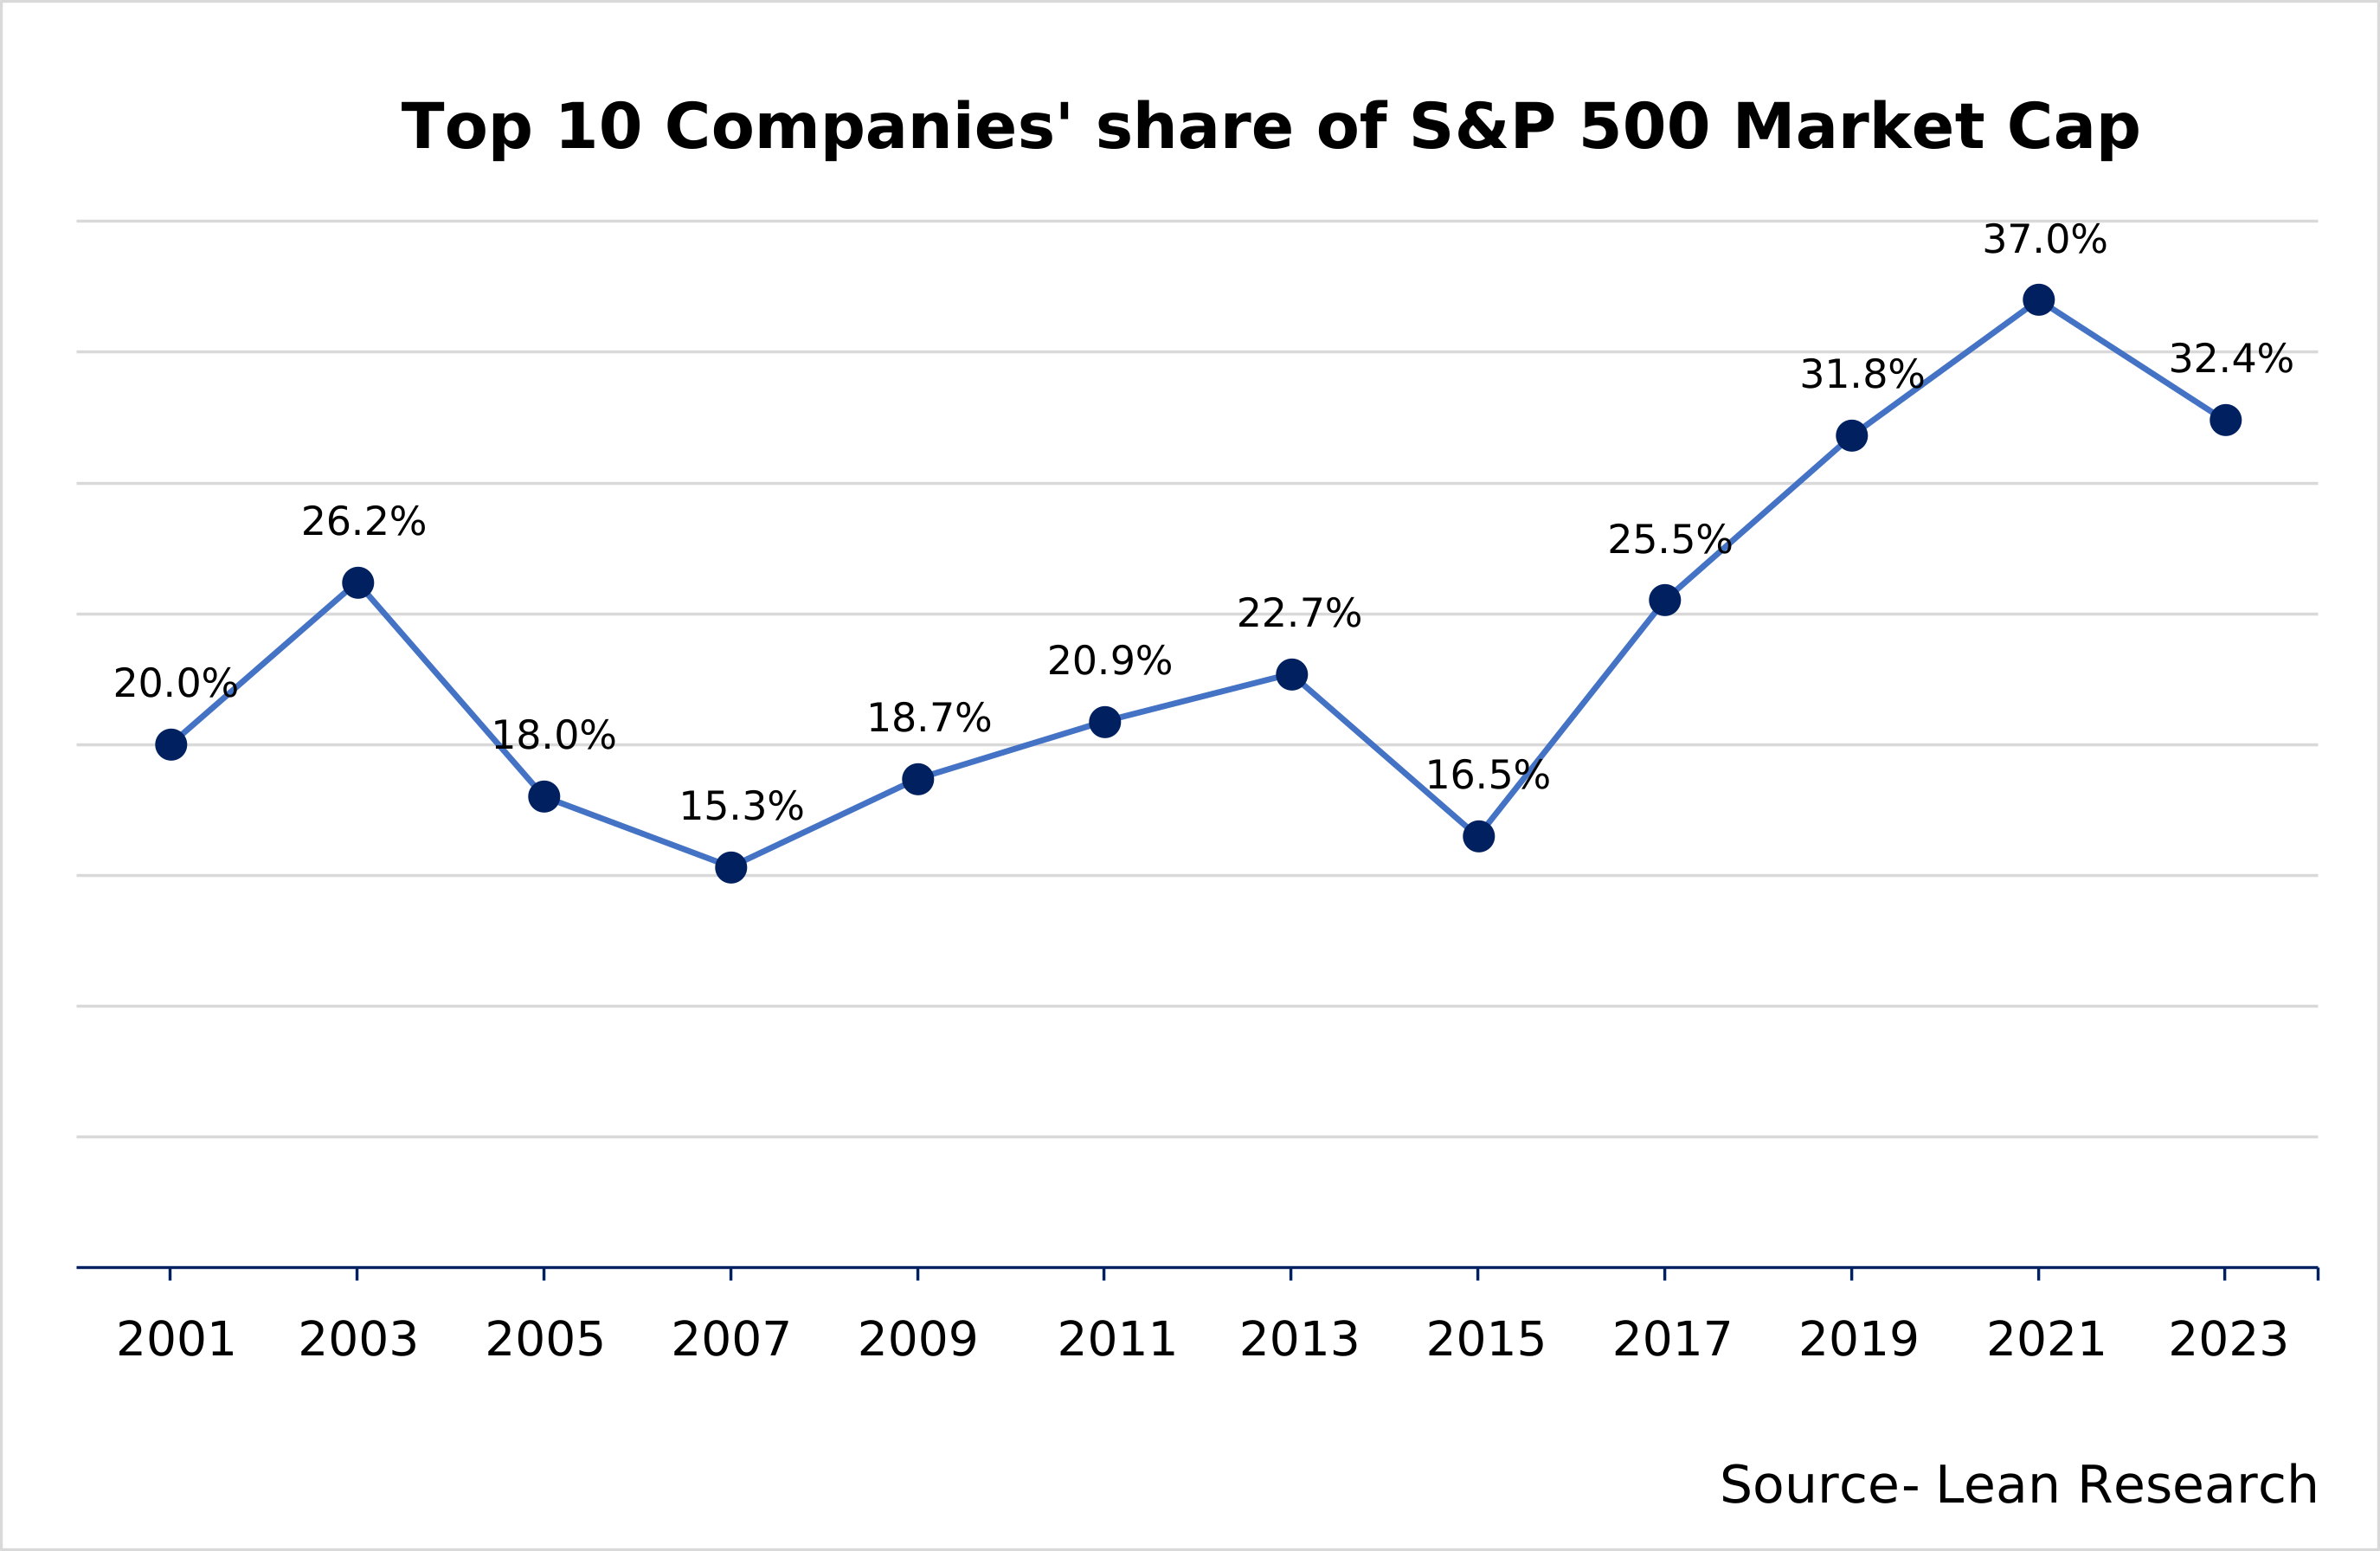
A Century of Dominance: S&P 500's Stalwarts Through 2000
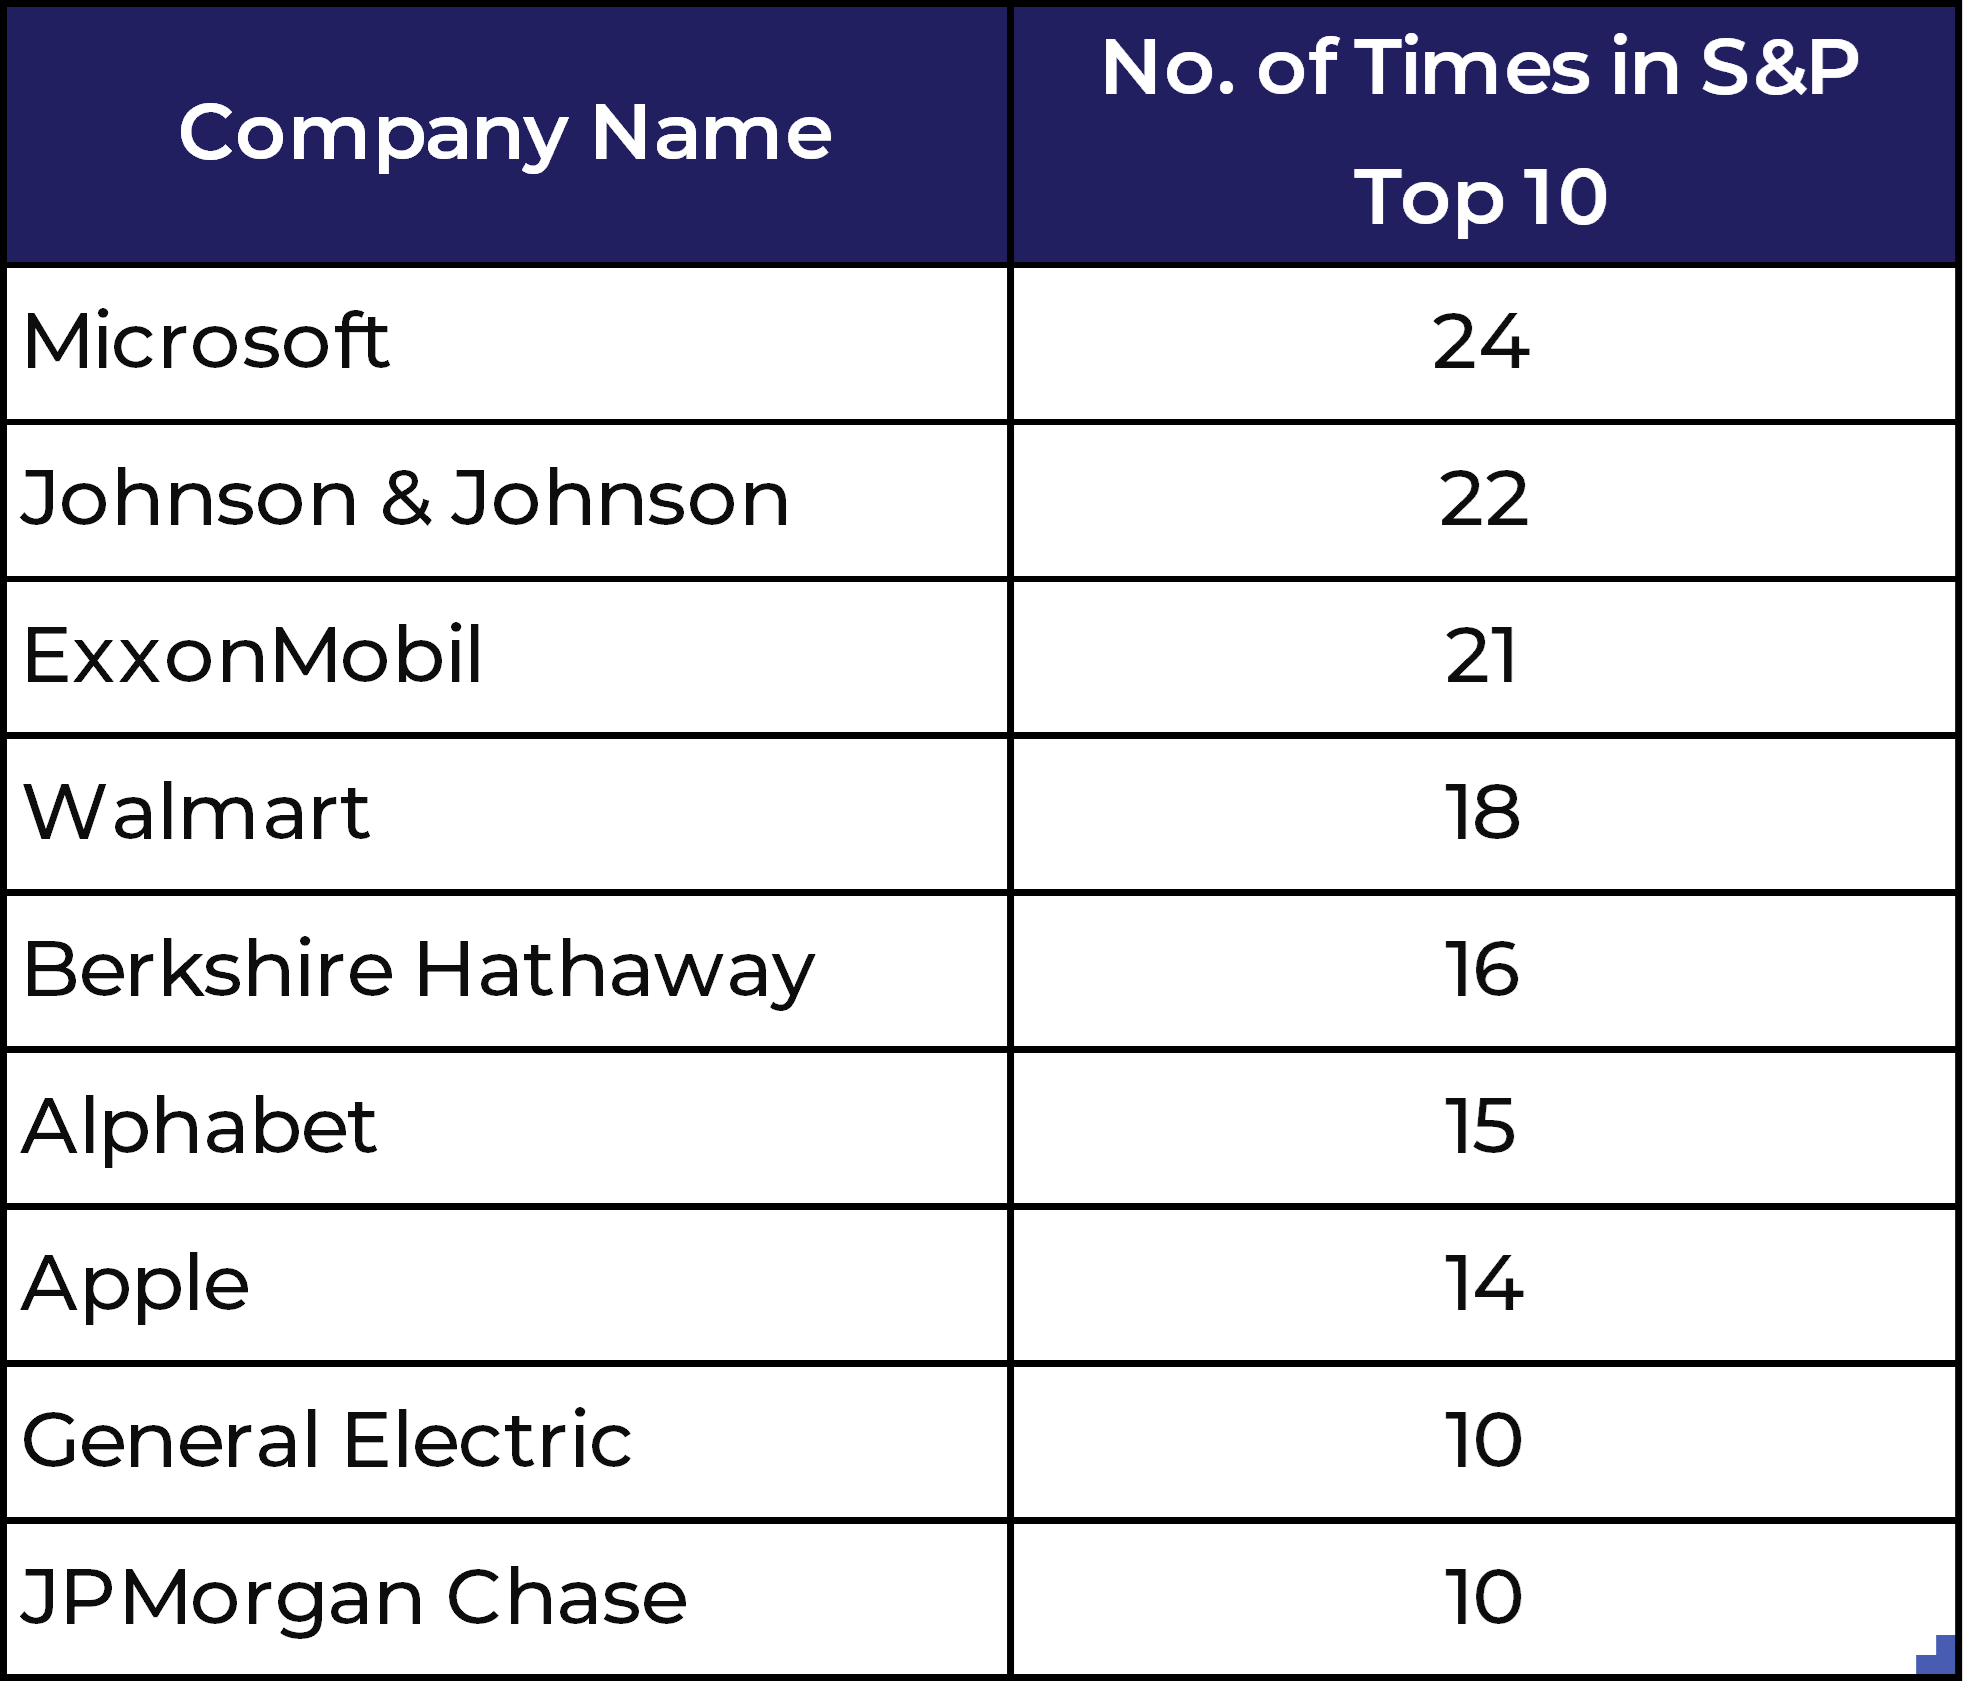
The Top 10 companies now trade at nearly 27x forward earnings. These group differences increased the total valuation to 19 times, which seems a lot compared to the long history of around 15 times. Leading the frequency chart, Microsoft, ExxonMobil and Johnson& Johnson appear as consistent fixtures, signaling their robust market presence and the economic landscape of their respective eras. Close behind are companies like Berkshire Hathaway and Walmart.
The coefficient that correlates movement:
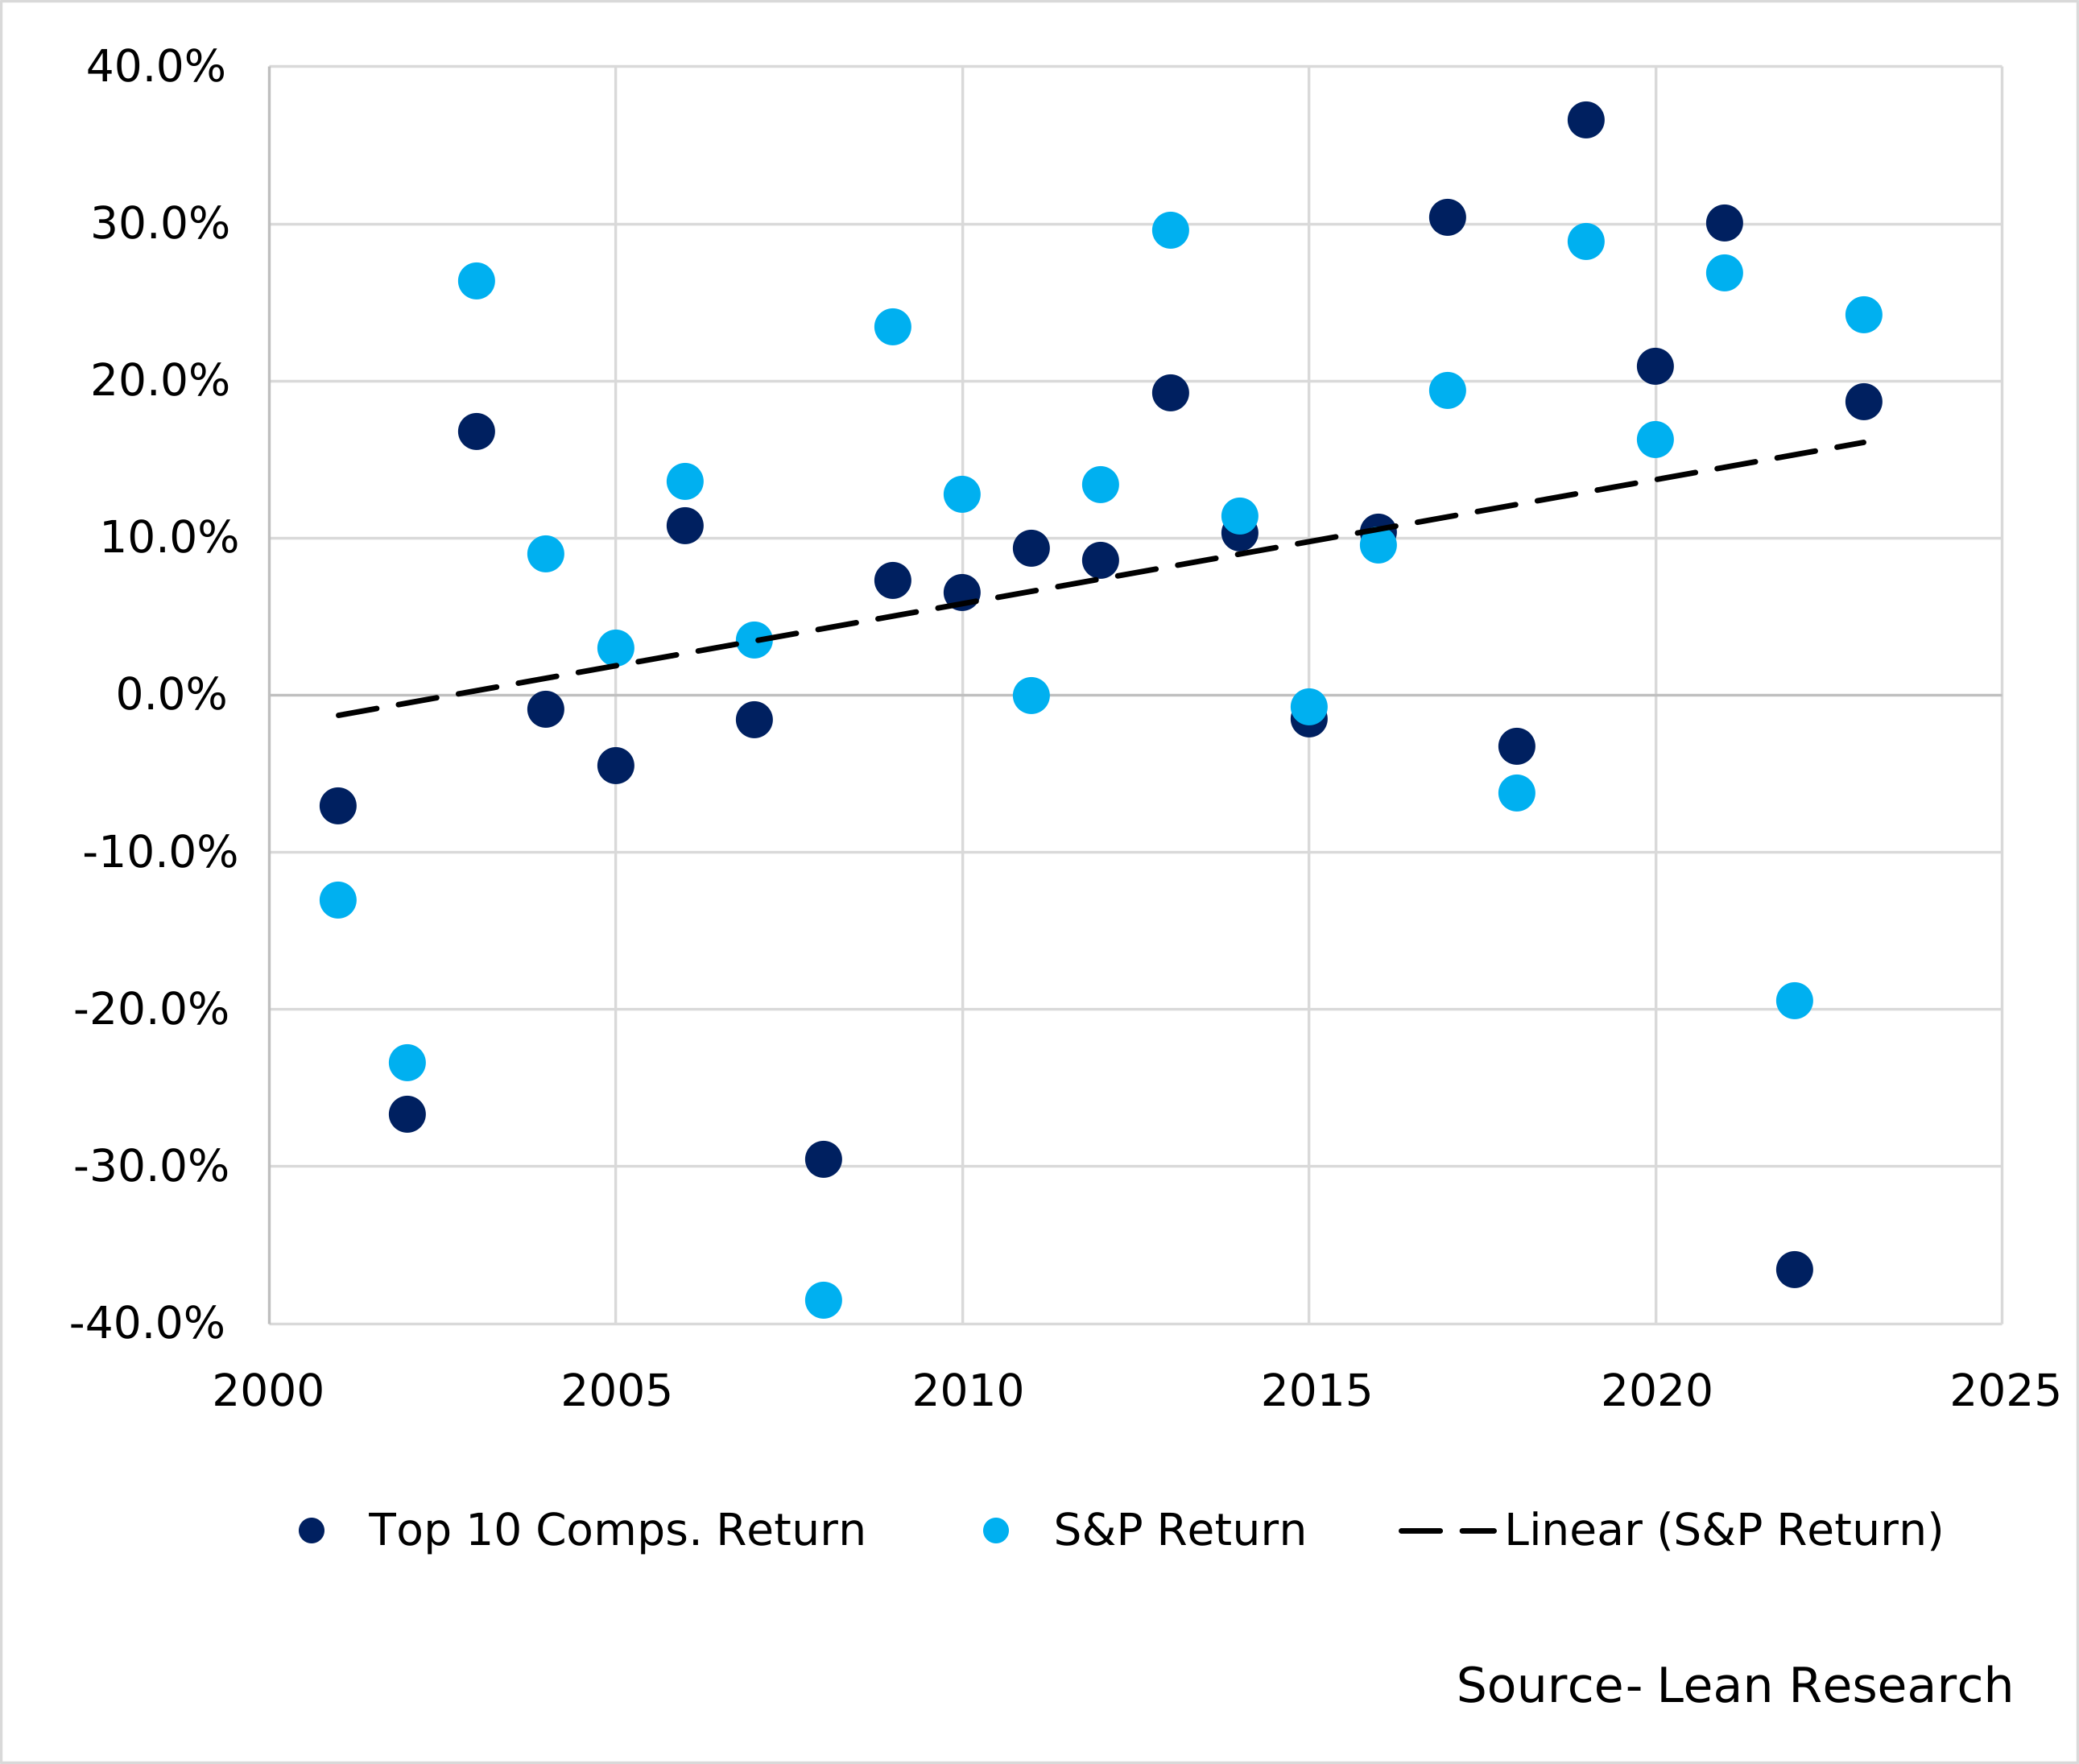
In the realm of finance, the term Symphony Correlation describes how the movements of two different things are interconnected. Here, we compare the annual yields of corporations that are on the top ten list of companies belonging to the S&P 500 with the overall performance at S&P 500. Over the past two decades, there has been a strong correlation coefficient of 0.91 reflecting the positive nature of this connection is evidence that they might not be followers but leaders among their peers.
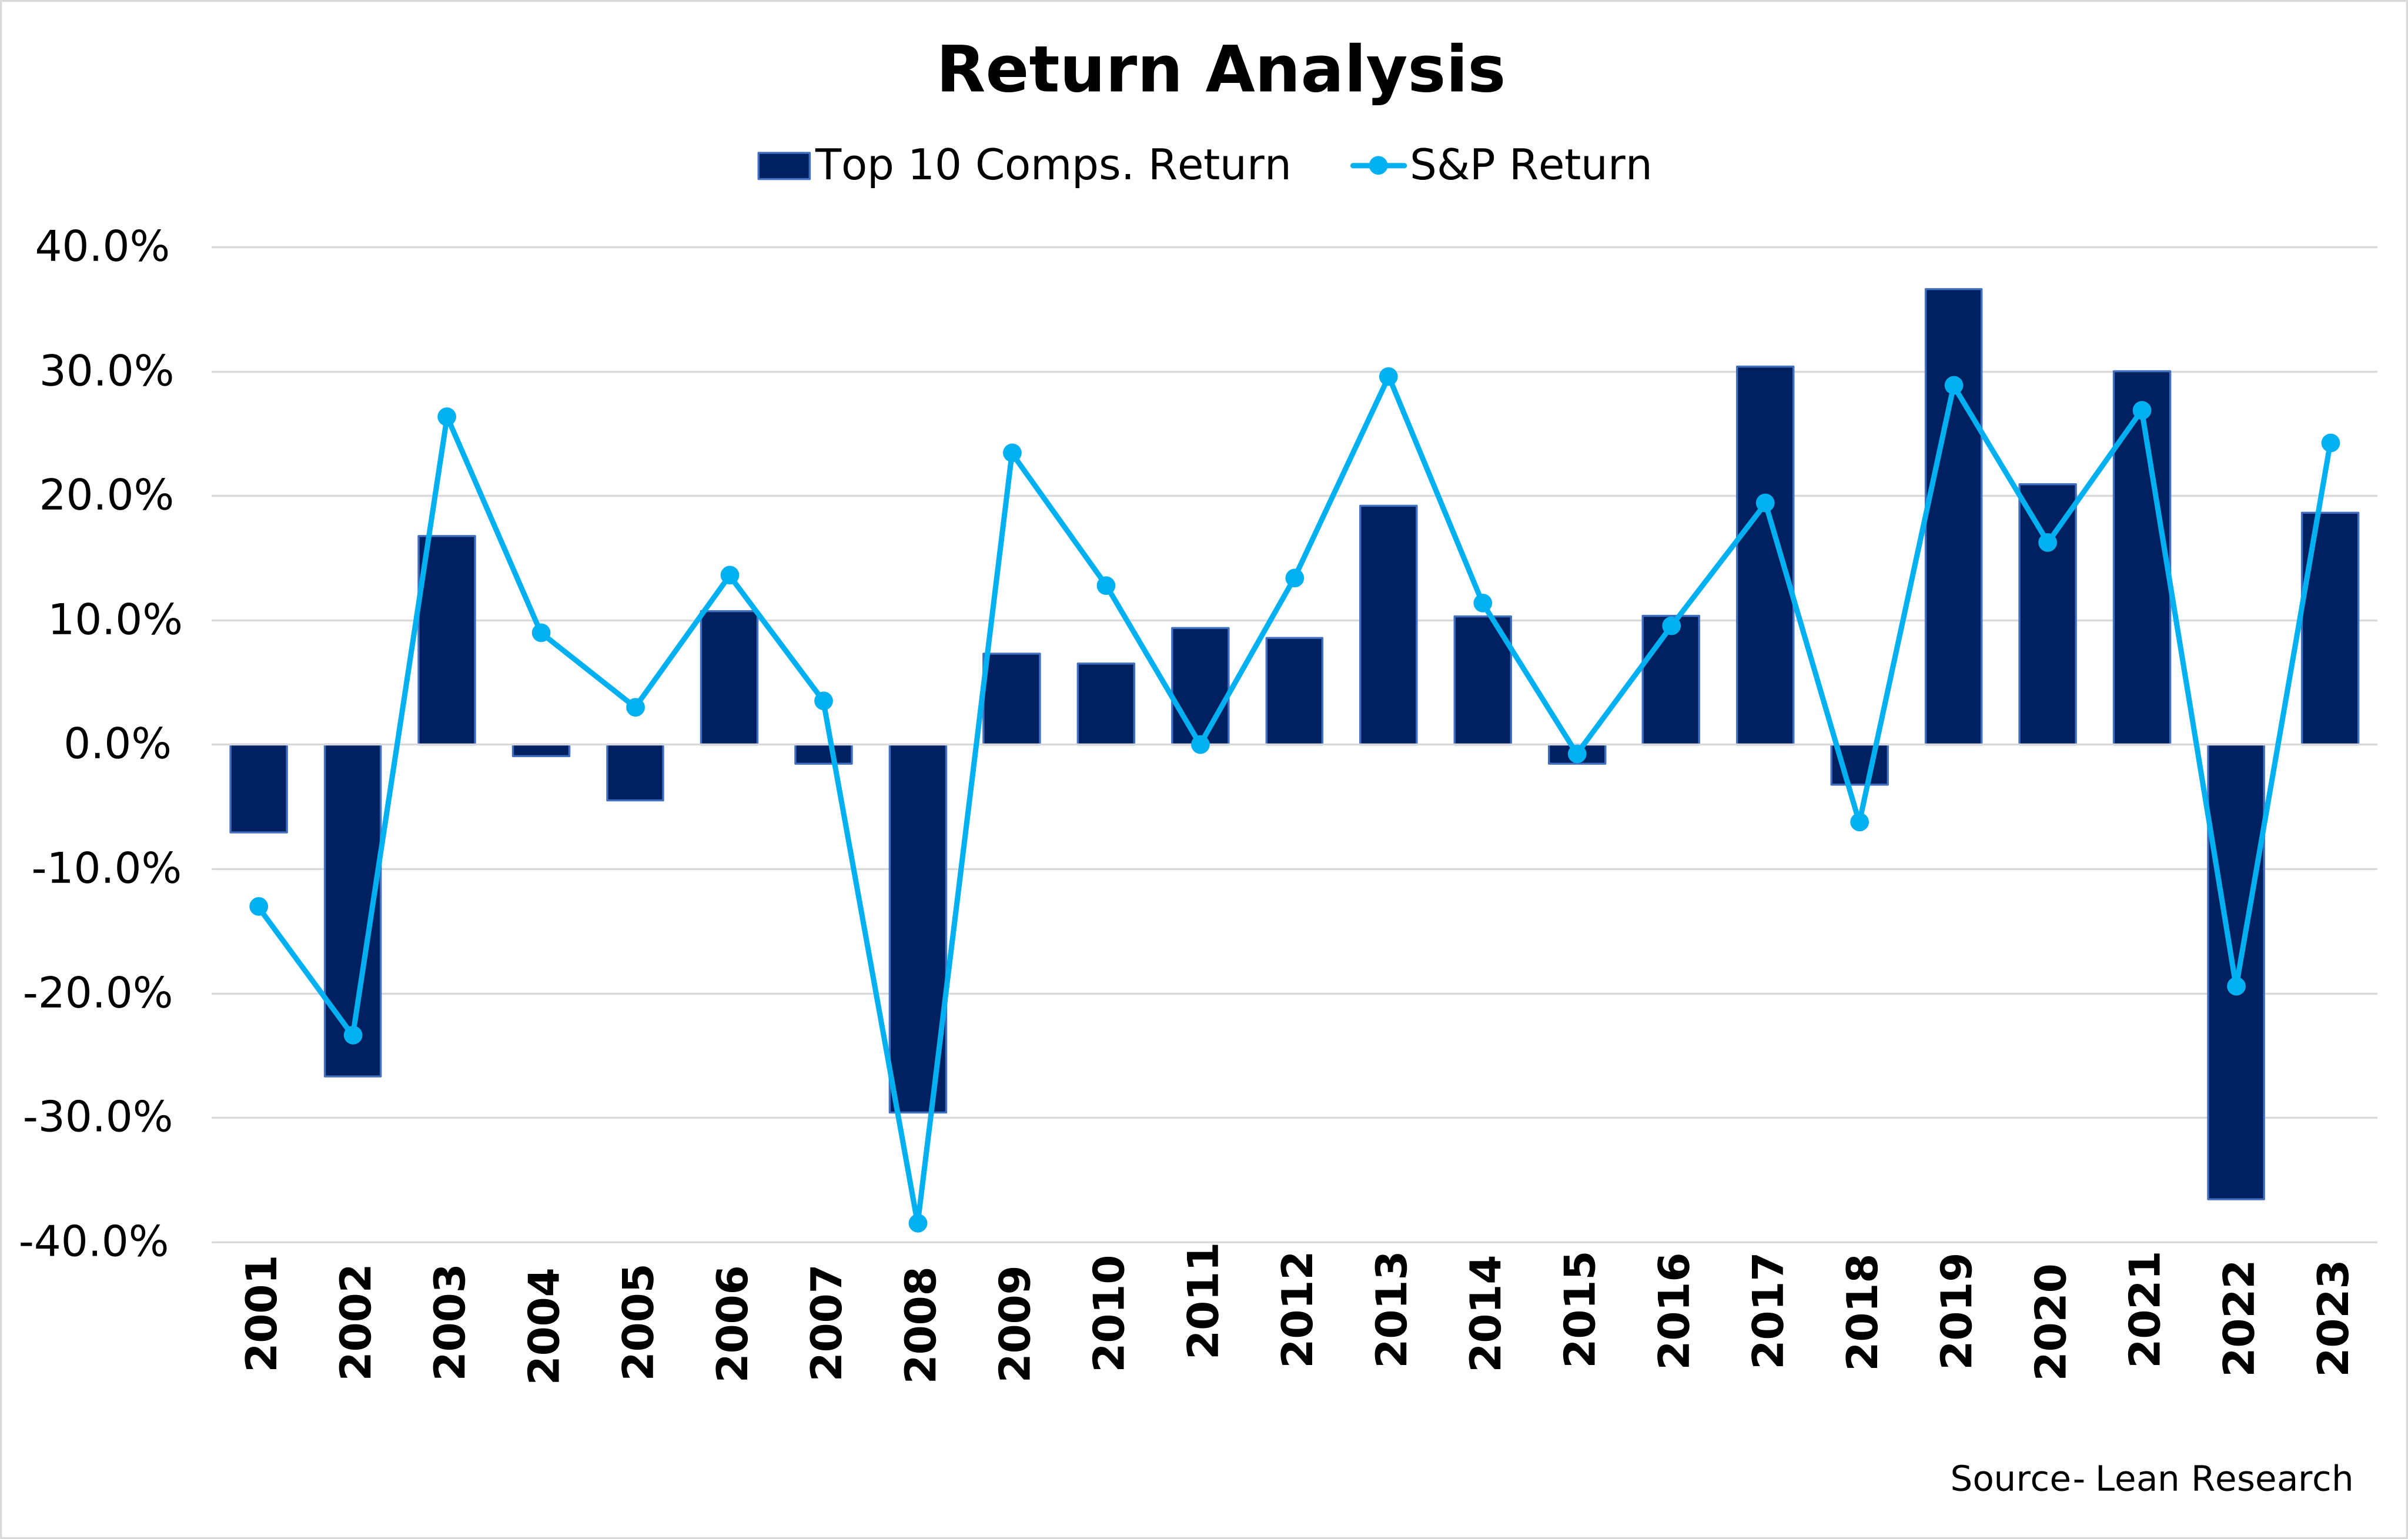
A Scatter Plot Analysis of S&P 500 Leaders:
The fact that the top 10 companies in the S&P 500 tend to move in the same direction as the S&P 500 itself reinforces the idea that mega-cap concentration is a significant force in the market.
The Hidden Dangers of S&P 500's Mega-Cap Obsession: A Tail Risk Warning
First, S&P 500 investors may believe they are investing in a basket of 500 companies but the top 10 mega-cap companies in the index have accounted for as much as 35% of its entire market capitalization in recent months compared with an average of 20% over the past 35 years. This means that funds invested in the S&P 500 are increasingly invested in the health of a handful of companies, while the base of the other 490 companies is less affected.
Additionally, high valued stocks keep increasing in value. This poses a risk as the high P/E ratios are influenced by the prevailing low interest rates that make the future earnings appear more appealing to the market operators. If the Federal Reserve continued to hold rates high for a more extended period, there is a chance that greater fluctuations might be experienced by the index rate than what a good number of individuals are aware of.
Discover the Lean Advantage: Offshore Insight, Onshore Impact.
Lean Research enhances your investment strategy by delegating the detailed grunt work to our offshore analysts, freeing your onshore teams to focus on high-value tasks. With our dedicated full-time members embedded in your operations, we ensure that every piece of analysis not only meets but exceeds your standards. Experience the ease of expanding into new markets and asset classes while driving better investment returns, all in a cost-efficient manner. Lean Research is your partner in redefining asset management efficiency.