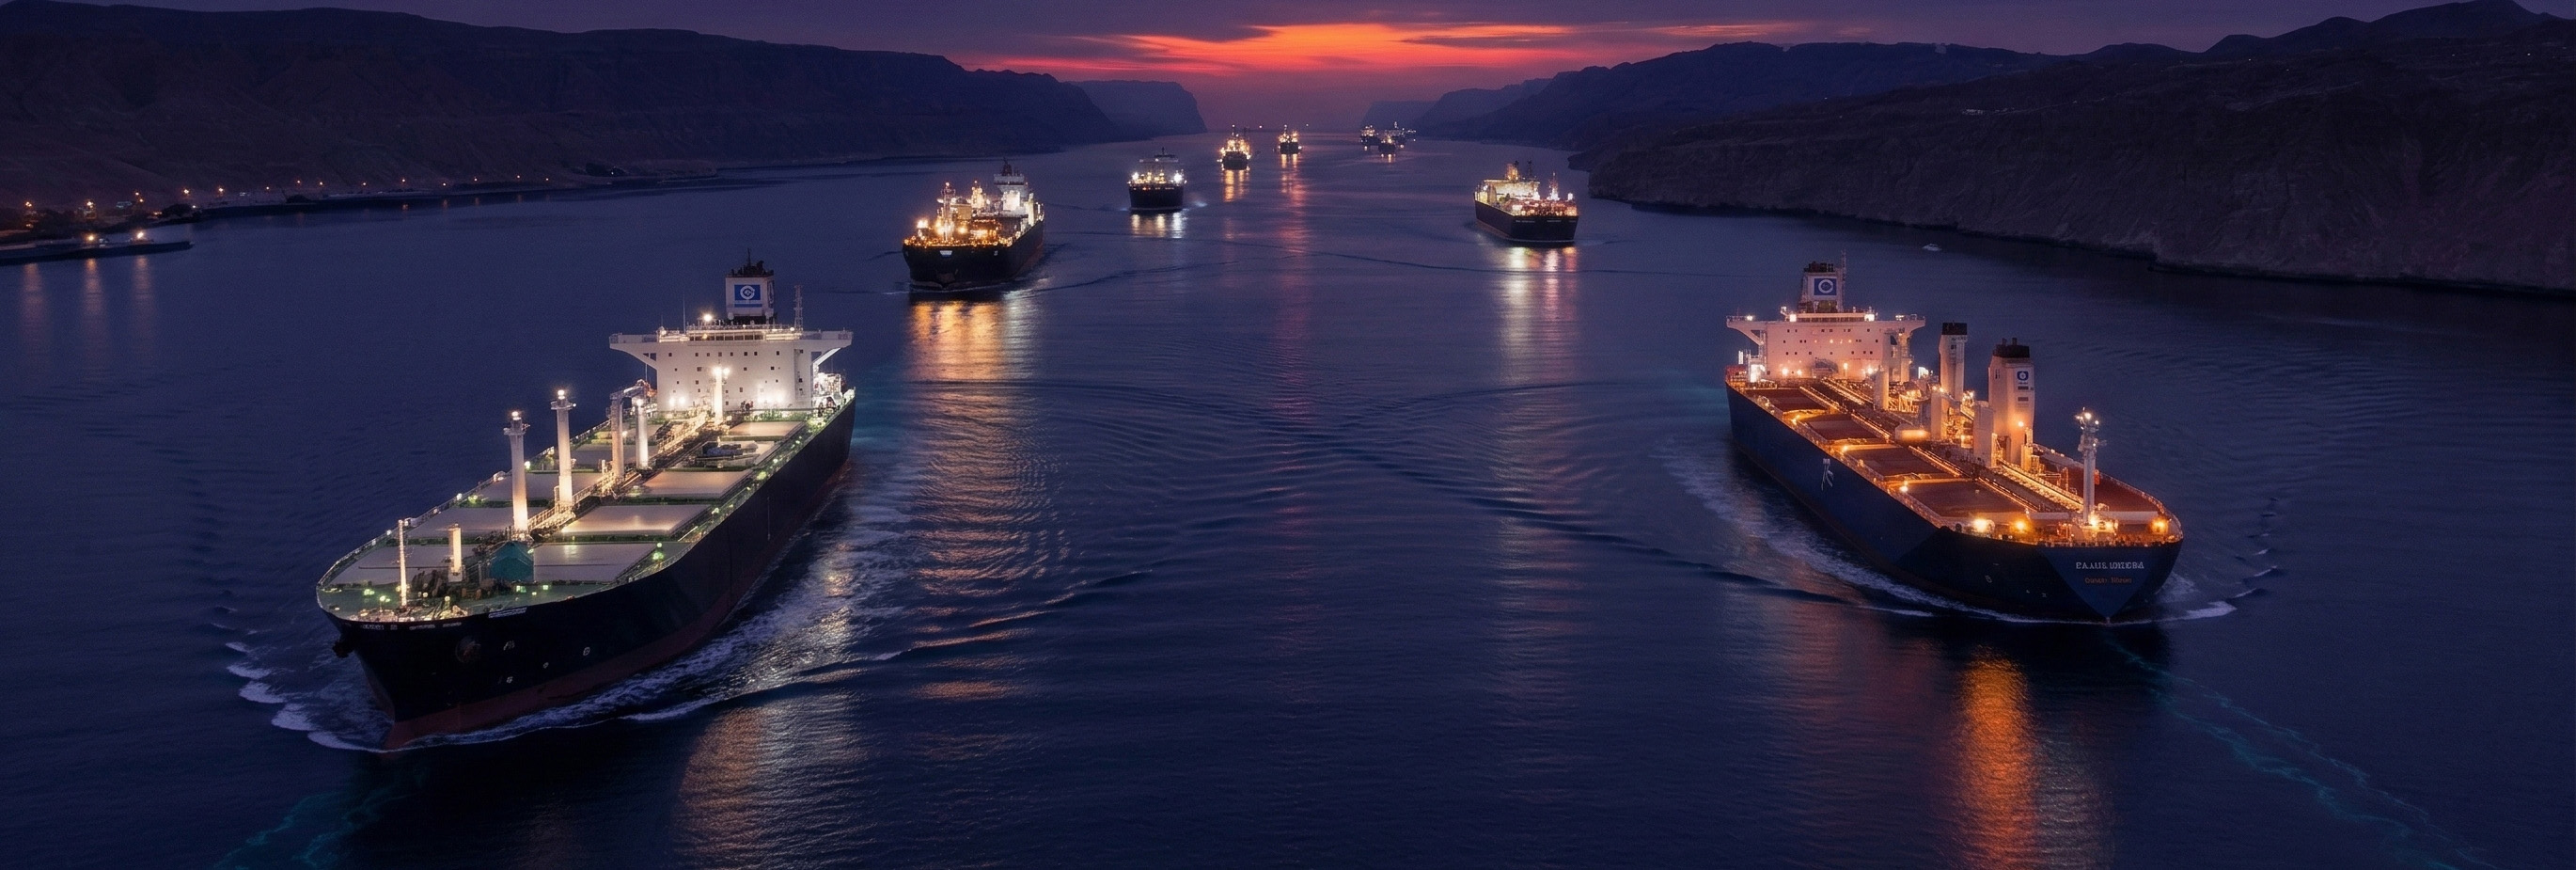
Iran, the Strait of Hormuz, and the Price of Duration - Global Oil Market Risk and Energy Security
Why the Iran-Hormuz Conflict Now Matters Far Beyond Crude Oil Prices
For most readers, the Iran-Hormuz conflict enters markets through one chart oil. Brent rises, gold rallies, the dollar strengthens, and risk appetite softens. That is the first move. It is not the full story.
The more important issue is whether this remains a brief geopolitical spike or becomes a longer disruption to the commercial systems that move energy and shape inflation. That is where the current conflict becomes much more consequential. Iran sits next to the Strait of Hormuz oil chokepoint, the most critical node in global Middle East energy security, while the region is also dealing with threats to LNG flows, freight, shipping insurance, aviation corridors, and business continuity. At the same time, Iran itself is navigating a leadership rupture and a much more uncertain political transition.
That is why this is no longer just an oil story. It is becoming a broader repricing of commercial certainty.
Why Iran Matters Structurally to Global Energy Markets and Oil Supply
Iran matters because of position as much as production.
The Strait of Hormuz carries about 20 mbpd of oil and petroleum products. That is roughly 20% of global petroleum liquids consumption and more than one quarter of global seaborne oil trade. It also carries around 20 to 22% of global LNG trade, with more than 100 bcm of LNG annually at risk in severe disruption scenarios. Most of these energy flows move toward Asia, with some estimates putting the share at 84% of oil and 83% of LNG.
That concentration explains why a Hormuz disruption is not just a Middle East problem. It is immediately an Asia energy-security problem, a Europe LNG problem, and a global inflation problem.
The market tends to describe Hormuz as a physical chokepoint. It is that. But it is also a confidence chokepoint. The route does not need to be fully blocked to become economically disruptive. It only needs to become hard to insure, expensive to navigate, and uncertain enough that cargoes stop moving under normal commercial assumptions.
What History Tells Us About Iran Oil Shocks and Geopolitical Risk Pricing
History offers a more useful lesson than the usual headline reaction.
Past Iran-related crises often produced violent first moves in oil, but many of them did not become lasting oil crises. The Iran-Iraq War, the Tanker War, later naval confrontations, threats around Hormuz, the withdrawal from the nuclear deal, and the Soleimani episode all showed some version of the same pattern: the market reacts quickly, then reassesses whether transport, supply, and commercial trust are actually impaired for long enough to matter.
That is the key distinction. Oil does not stay high because an event is dramatic. Oil stays high when the market concludes that global oil supply disruption has produced all of the following
- Persistent supply loss
- Prolonged shipping disruption
- A durable insurance and freight shock
- A confidence shock that survives the first panic
The historical lesson is not that the current conflict is harmless. It is that the right variable is duration, not only severity.
Not Just a Supply Shock How War-Risk Insurance Is Disrupting Global Shipping
The first real break in the current episode is insurability.
War-risk cover has become more expensive and, in some cases, harder to obtain. Premiums have reportedly jumped from around 0.2% to 1.0% of vessel value within roughly 48 hours. Around 150 to 200 ships have been described as anchored, delayed, or reluctant to move through or near Hormuz. Freight on the key Middle East to Asia route has surged, with some voyage costs nearing $12 million.
This matters because a route can become commercially impaired before it becomes physically closed. Once insurers step back and shipowners hesitate, the market begins to tighten before actual production losses are fully visible.
That is why this should be understood as an insurability shock before it becomes a full physical supply shock.
The Second Market Failure Energy Deliverability and Oil Supply Chain Disruption
The next break is deliverability.
A supply shock means barrels disappear. A deliverability shock means barrels still exist, but the market is no longer sure they can be nominated, insured, shipped, financed, and received on time.
That is the key commercial distinction in a Hormuz event.
Only limited bypass capacity exists. Available Saudi and UAE pipeline routes that can avoid Hormuz are estimated at roughly 2.6 mbpd, with some broader installed figures showing somewhat higher capacity but still far below the 20 mbpd that normally transit the Strait. In severe disruption scenarios, even after rerouting, as much as 9 mbpd of crude and 6 mbpd of refined products could still remain exposed.
That is why this conflict cannot be reduced to “there are enough barrels.” In a route-driven shock, accessible supply matters as much as total supply.
The Third Failure Crude Oil Benchmark Integrity Under Geopolitical Stress
One of the most underappreciated developments is pressure on benchmark formation itself.
Once pricing agencies suspend bids and offers for Middle Eastern crude, refined products, or LNG because safe cargo nomination can no longer be assumed, the problem has moved beyond freight and geopolitics. It has entered the market’s own operating architecture.
This matters because benchmarks anchor far more than headline oil commentary. They shape the following
- Airline fuel hedging
- Refinery margin management
- Petrochemical feedstock pricing
- Inflation assumptions
- Cross-asset portfolio positioning
Once benchmark integrity is under stress, the premium stops being just a flat-price premium. It becomes embedded in the market’s own plumbing.
Why Qatar LNG and Gulf Gas Flows May Prove More Disruptive Than Crude Oil
Much of the public conversation still focuses on crude first. The LNG channel may be just as important, and in some cases even more disruptive.
About 20 to 22% of global LNG trade is exposed to Hormuz. Qatar is central to this. If Gulf LNG is materially disrupted, Europe and Asia are pushed into more direct competition for replacement cargoes. That is a much harder market to stabilize quickly than crude oil. There is no true strategic LNG reserve equivalent to oil SPRs, and replacement capacity cannot be brought on fast enough to offset a major Gulf loss in the near term.
This is why the upside scenarios for TTF gas prices and the European gas market are so important.
More severe cases point to the following:
- TTF at €60/MWh in a serious but manageable disruption
- TTF at €80 to €100/MWh if markets begin pricing a prolonged loss of Qatari LNG flows
- Roughly $28 to $35/MMBtu in upper-end stress cases
The gas side matters because LNG shortages do not only raise prices. They can force demand destruction.
Diesel, Jet Fuel, and Refined Products as an Underpriced Global Inflation Channel
The Gulf is not only a crude corridor. It is also a refined-products corridor.
Around 6 mbpd of refined products move through Hormuz. That matters because refined products feed directly into freight, aviation, logistics, and industrial costs. Middle distillate markets have already begun tightening, with some sources showing the gasoil crack moving above $30 per barrel from roughly $27 per barrel.
This is where the conflict starts to hit the real economy faster than a simple crude chart suggests. Diesel, jet fuel, and other distillates are what businesses actually consume. If these markets tighten, the shock spreads quickly into transport costs and broader inflation.
Why OPEC+ Spare Capacity, Strategic Petroleum Reserves, and US Shale Cannot Fix a Route Disruption
Whenever oil rises, the standard response is to point to spare capacity, strategic reserves, or U.S. shale.
Those buffers matter. They are not enough on their own.
OPEC+
The latest increase discussed is 206,000 bpd, versus an earlier expected pace of 137,000 bpd. Compared with 20 mbpd normally transiting Hormuz, that is very small.
Strategic reserves
The U.S. Strategic Petroleum Reserve is around 415 million barrels, roughly 35% smaller than at the start of 2021. IEA government-controlled stocks are above 1.2 billion barrels, and obligated industry stocks add another roughly 900 million barrels. These are meaningful buffers, but they are temporary relief, not a restoration of commercial confidence.
U.S. shale
Shale can respond, but the lead time is still around 6 to 12 months, not immediate.
LNG replacement
More LNG capacity is coming, especially from the U.S., but not quickly enough to offset a major Gulf disruption in the near term.
So yes, there are buffers. But they buy time. They do not instantly repair damaged corridors.
From Oil Price Shock to Central Bank Rate Cut Delay the Inflation Feedback Loop
The most interesting macro effect of this conflict may be that it is becoming a rate-cut delay shock.
A short-lived spike in oil is manageable for most central banks. A persistent rise in energy prices, combined with higher shipping and insurance costs, becomes much harder to ignore. That is where the conflict starts to change inflation paths, current-account balances, and terminal-rate expectations.
This is especially important because many markets were already positioned for easier policy. The conflict does not need to create recession to matter. It only needs to keep inflation sticky enough to make central banks more cautious.
How the Iran-Hormuz Shock Hits Differently Across the US, Europe, Asia, and Emerging Markets
This is not a uniform global inflation shock. It is a highly uneven one.
United States
The U.S. is less exposed than in past decades because it is now a major oil and gas producer.
Relevant numbers set
- energy goods and services are less than 4% of U.S. consumer spending
- About half of that is gasoline
- A 10% increase in crude oil prices raises PCE inflation by roughly 10bp in the near term
- A 10% increase in energy prices is estimated to weigh on U.S. GDP by no more than 10bp
- A 50% sustained increase in crude could lower growth by more than 50bp in a more nonlinear scenario
So the base case for the U.S. remains manageable. But the caveats are important. Higher inflation expectations, lower-income household pressure, equity-related wealth effects, and a broader tightening in financial conditions could still make the macro impact more significant if the shock persists.
Euro area
Europe matters more.
As a net importer of oil and a key LNG buyer, the euro area faces weaker growth and higher inflation if energy prices stay elevated.
Estimates suggest the following
- A $10 permanent oil increase could reduce cumulative growth by 20 to 30bp over 2026 to 2027
- The same shock could lift cumulative inflation by 40 to 60bp
- Near-term inflation could move closer to 2.5%
- Even a temporary quarter-long shock could still add about 20bp to average 2026 inflation
- Short-term growth could fall around 10 to 20bp
The ECB problem is therefore real. Small and brief shocks can be looked through. Larger and more persistent shocks can delay cuts, and in more severe scenarios can even trigger a more defensive stance before deeper easing later.
Central and Eastern Europe
CEE is one of the clearest places where this becomes a rate-cut shock.
Inflation sensitivity figures are as follows
- Türkiye: +1.10pp CPI for a 10% oil increase
- Romania: +0.50pp
- Hungary: +0.45pp
- Poland: +0.35pp
- Czech Republic: +0.20pp
Other relevant figures on oil import dependency
- Every $10 per barrel increase may raise CEE oil import bills by around 0.1 to 0.15% of GDP
- Hungary and Poland are slightly more sensitive than peers on that metric
This matters because the region also had easing expectations and meaningful positioning. Higher oil plus weaker FX plus stickier inflation makes it much harder for central banks to move quickly.
Asia
Asia absorbs the biggest external-account shock first.
Relevant figures on Asia oil import dependency and emerging market currency risk include
- Around 60% of Asia’s oil comes from the Middle East in one framework
- Japan depends on the region for roughly 90% of its oil imports
- Korea around 70%
- India roughly 46 to 55%, depending on source framing
- China about 38%
- A 10% rise in oil prices can worsen current-account balances by around 40 to 60bp in some exposed economies
- On average, a 10% oil increase raises CPI by about 0.2pp in Asia
- Japan has reserves equivalent to about 254 days of domestic consumption
- Korea has around 7 months of stockpiles
- route disruption can extend trade shipments by 10 to 12 days in some cases
Asia is not entering this shock with the same inflation backdrop as 2022. Demand is more normal and policy buffers are better in some places. But if energy prices remain high, Asia becomes the first place where import bills, current accounts, fuel inflation, remittances, and shipping costs begin to visibly deteriorate.
Oil Exporters vs Importers How the Iran Shock Redistributes Growth and Current Account Risk
This conflict is also a redistribution shock.
Examples
- Canada could see roughly +30bp GDP growth over the following year from a sustained 10% oil rise
- Türkiye could see its current-account deficit widen by about $5 billion, or 0.3% of GDP, from a 10% energy-price increase
- Egypt could see a $10/bbl increase widen the current account by about $1 billion, or 0.3% of GDP
- Pakistan has an energy import bill of around $15 to $16 billion, roughly 4% of GDP
- Sri Lanka around $4 to $4.5 billion, roughly 4.5% of GDP
Commodity exporters, including parts of CIS, Canada, and some LatAm and SSA economies, gain from stronger terms of trade. Importers face the opposite.
Why the Dollar and FX Markets May Amplify the Iran Oil Shock More Than the Oil Chart Itself
The dollar response matters because it turns an energy shock into a broader financial-conditions shock.
Higher oil and gas prices tend to pressure fossil-fuel importers’ currencies more than exporters’. That is why euro, yen, and many emerging-market currencies come under pressure if the shock persists. A stronger dollar then amplifies imported inflation, worsens current accounts, and undermines easing cycles that markets had already begun pricing.
This is how the Iran geopolitical risk premium spreads through financial markets
- From crude into currencies
- From currencies into inflation
- From inflation into delayed rate cuts
- From delayed rate cuts into broader risk repricing
Once that process begins, the conflict stops being just an energy trade and becomes a true cross-asset story.
Beyond Energy Business Continuity, Shipping, and Aviation Risk in the Gulf
The conflict is already reaching systems beyond energy.
Stress across several sectors
- Airports
- Ports
- Exchanges
- Shipping routes
- Aviation corridors
- Data centers and cloud infrastructure
- Bank and corporate contingency planning
- Tourism and retail activity
That matters because Middle East exposure is no longer just an upstream energy question. It includes any company that uses the Gulf as a logistics hub, operational base, financing center, or digital infrastructure node.
This type of disruption can outlast the first oil spike and keep the regional risk premium elevated even if crude later stabilizes.
Iran Regime Scenarios and What Each Means for Long-Term Oil Prices
Shipping disruption is visible. Iranian political continuity may prove more durable.
Several Iran regime scenarios
Scenario 1: Regime continuity or alteration
A replay of the shorter 2025 pattern.
Conflict cools after an intense phase.
Hormuz slows but normalizes.
Oil can eventually fall back into the $60 to $70/bbl range.
Scenario 2: Peaceful transition
Low probability, but most bearish for oil.
Potential sanctions relief and release of up to 100 million barrels tied up in transit or shadow-market channels could pressure oil toward the $50 to $60/bbl range.
Scenario 3: Chaotic transition
Bullish for oil.
Domestic instability reduces supply for longer.
Oil could remain in a $70 to $90/bbl range.
Scenario 4: Regime hard-lining
One of the most bullish scenarios.
Extended regional war, infrastructure attacks, Hormuz disruption, and output loss.
Brent could move into $80 to $100+/bbl, with some worst-case frameworks extending toward $140/bbl.
This is why the Tehran political path may matter more than the first week of tanker headlines. If the state survives in a more brittle, securitized form, the premium may persist well after shipping begins to normalize.
Key Indicators to Monitor During the Iran-Hormuz Energy Crisis
The most useful checklist is operational. Monitor the following indicators
- Whether war-risk premiums fall back from around 1.0% of vessel value
- Whether the 150 to 200 ship backlog near Hormuz clears
- Whether pricing agencies restore normal deliverability assumptions
- Whether Brent stays stuck in the $80 to $90 zone or begins moving toward $100+
- Whether TTF remains contained or starts climbing toward €60 to €100/MWh
- Whether refined-product cracks continue widening
- Whether central banks begin explicitly delaying or softening expected rate cuts
- Whether FX stress becomes disorderly in energy-importing emerging markets
- Whether Iran’s leadership path points toward continuity, peaceful adjustment, or hard-lining
Bottom Line Iran Is Now a Cross-Asset Geopolitical Risk, Not Just an Oil Trade
The Iran conflict is no longer just an oil story. It is becoming a numeric duration trade across the whole commercial system.
The first move is familiar
- Brent higher
- Gold stronger
- Dollar firmer
- Risk off
The more important move comes next
- Delayed rate cuts
- Weaker importers
- Stronger dollar pressure
- LNG competition
- Refined-product stress
- Shipping and insurance dislocation
- Benchmark fragility
- A broader repricing of what it means for Gulf commerce to remain reliable
That is why this matters.
The premium is moving off the oil chart and into everything that depends on energy being not only available, but transportable, insurable, benchmarked, and politically stable enough to trust.